thingsboard
To monitor with a Thingsboard dashboard an optimization process, the first step to do is to install the IoT Gateway following this guide.
Then you need to configure the file /var/tb-gateway/conf/mqtt-config.json, to connect the tb-gateway to the MQTT broker where you the managers publish their updates and to indicate what MQTT topics should be monitored, following this guide.
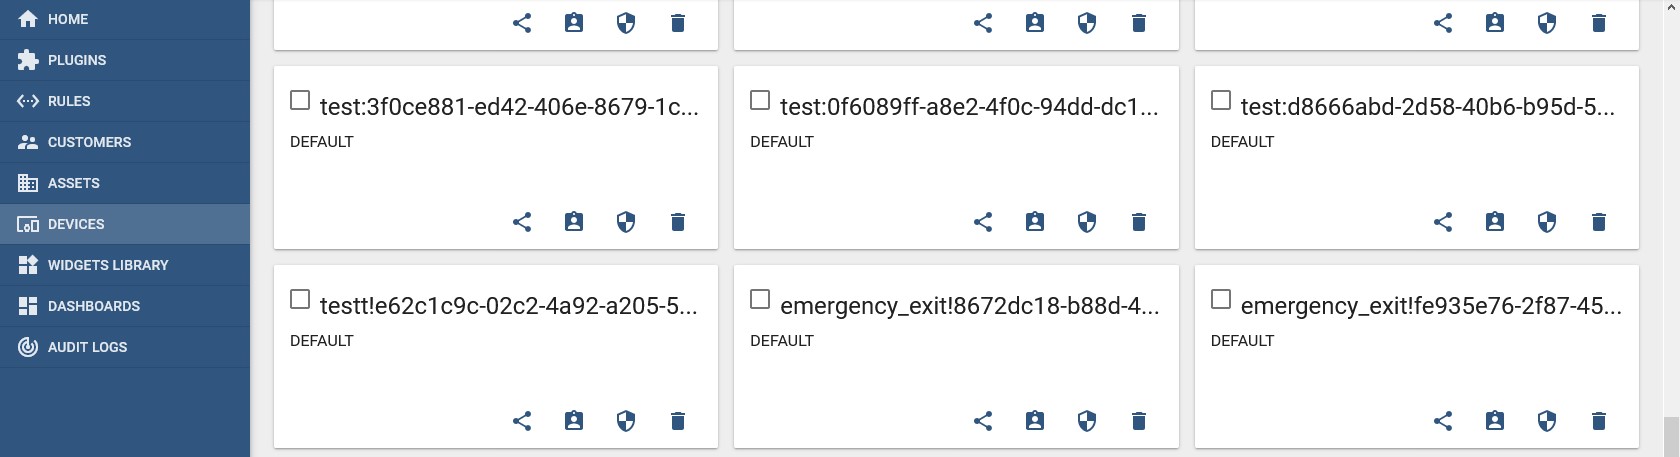
Once you have done these configuration steps, every time you start a new optimization process, you can see in the list of the device a new device, as shown in next figure
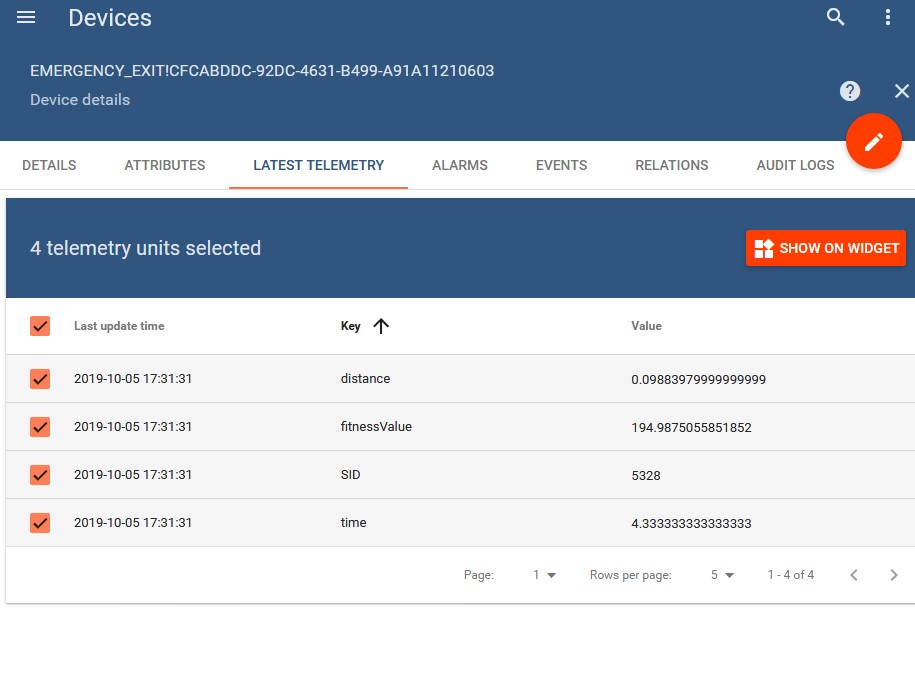
Click on the last device of the list, in the new window, select the "Latest Telemetry" tab, then sekect all the parameters that you want to monitor in the dashboard, like in the next figure:
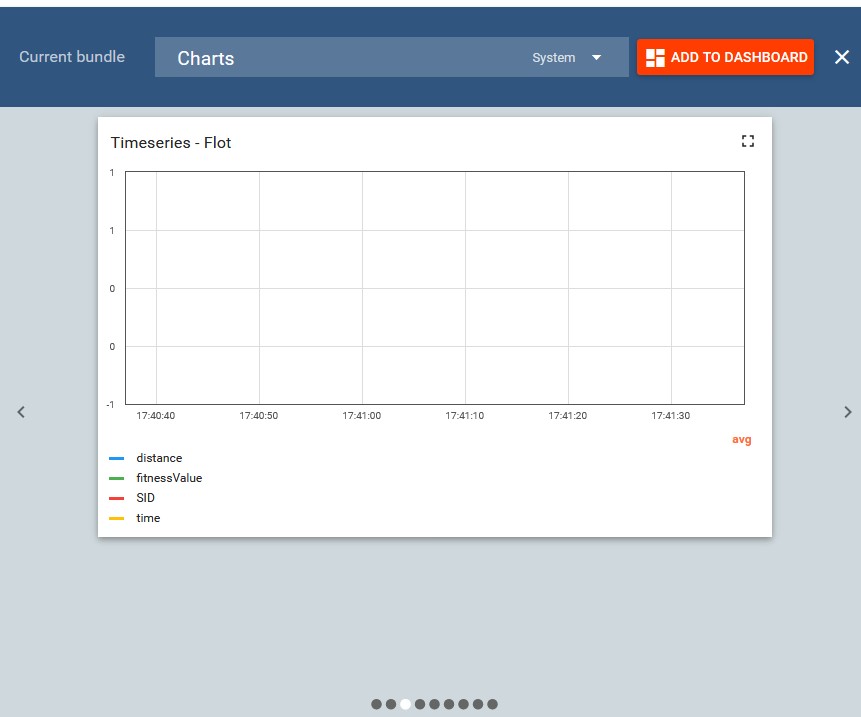
Then click on "Show on widget". This will open a new popup where you have to select the type of chart, in this case the most suitable is "Timeseries - Flot", to select this: before in the dropdown menu selects "Chart" and then clich the third point under the chart, as shown in the next figure:
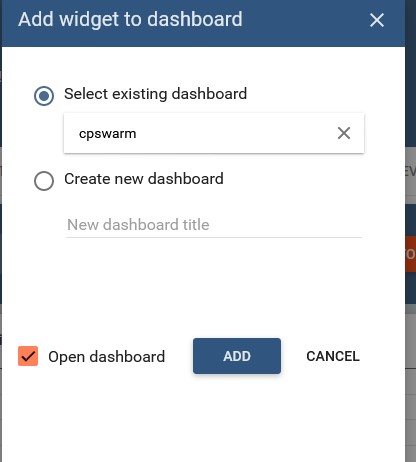
Then click on "Add to dashboard". In the new popup select one dashboard where you want to add the widget or create a new one and finally check "Open dashboard", like in the next figure:
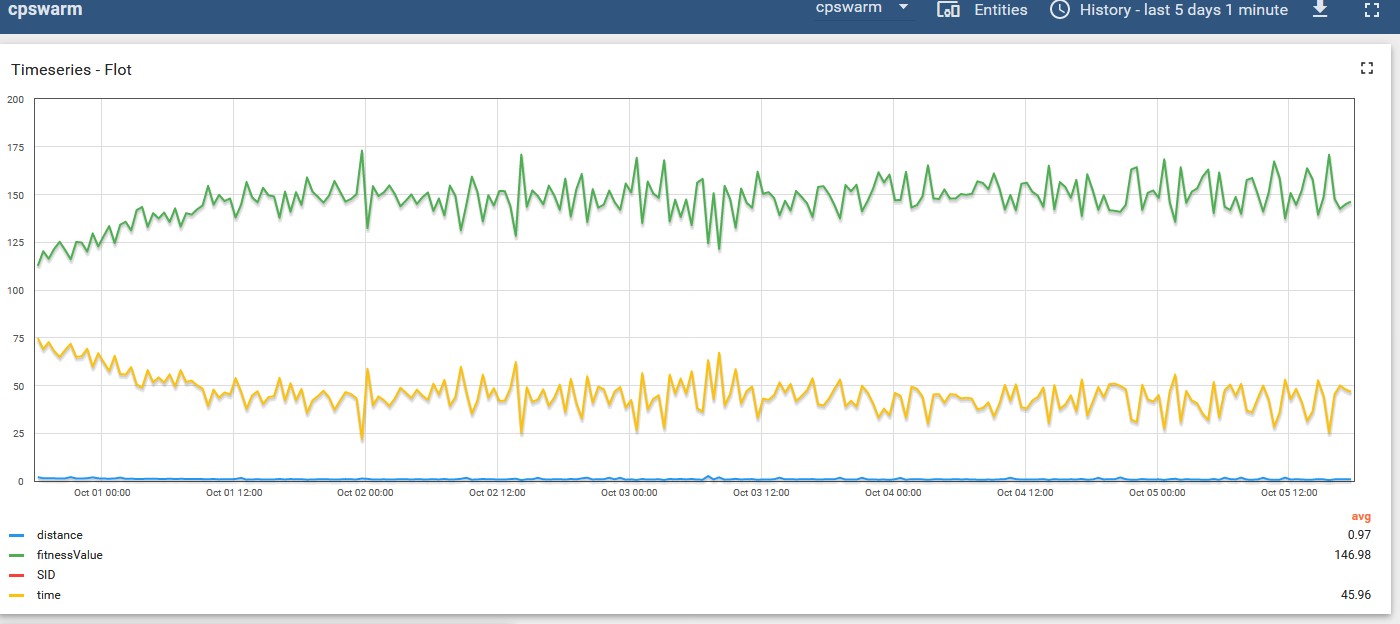
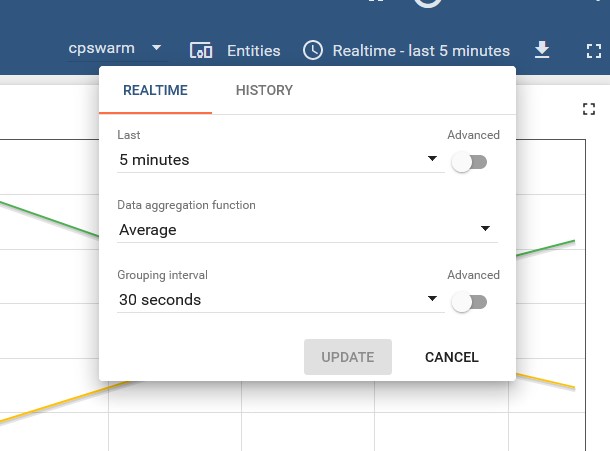
At this point, you can see the values in the chart, both monitoring real-time and history data, clicking on the current interval and then selecting the desired interval, as shown in the next figure:
The obtained chart should be somthing the one showed in next figure: